Innovation top 100
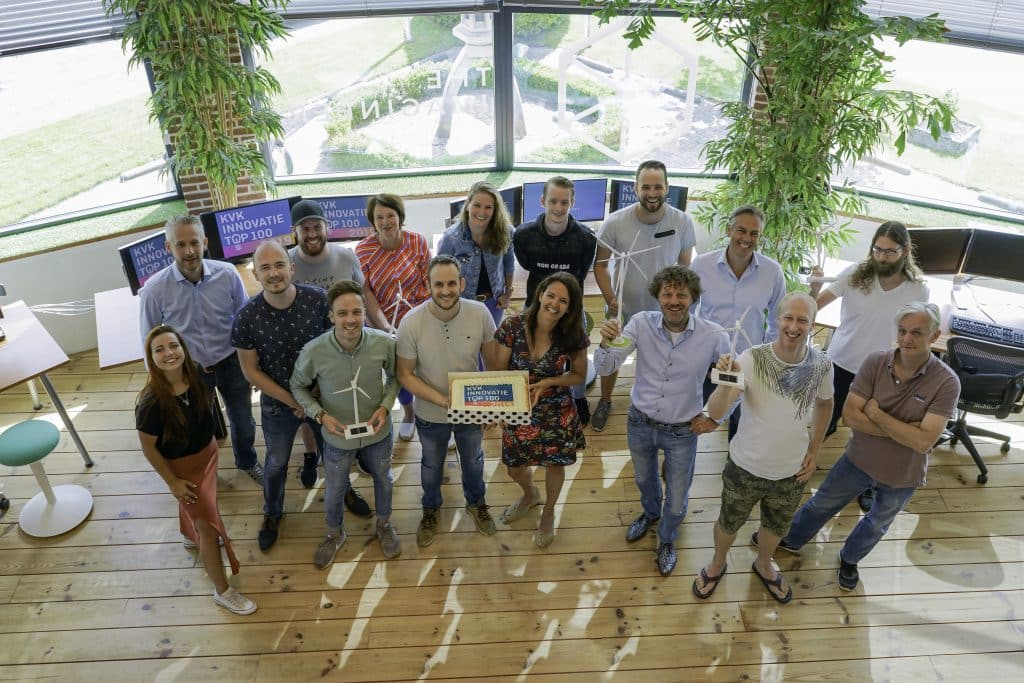
We are proud to announce that the Chamber of Commerce has selected Windplanner to belong to the 100 most innovative Dutch companies!
The chamber of commerce states:
Windplanner: Innovative visualization makes energy projects understandable.
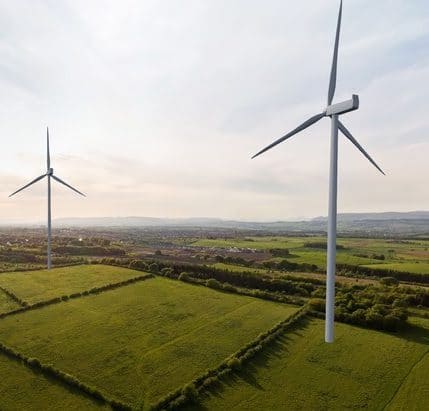
Clean energy is the future. Yet a wind or solar park in your immediate area is often difficult to imagine. “Not in my backyard” is a frequently heard response. But is that reasonable? With Windplanner, project developers can plan, visualize and communicate with the environment at an early stage about the effects of a windmill project.
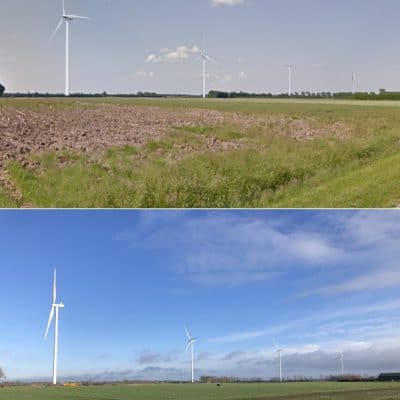
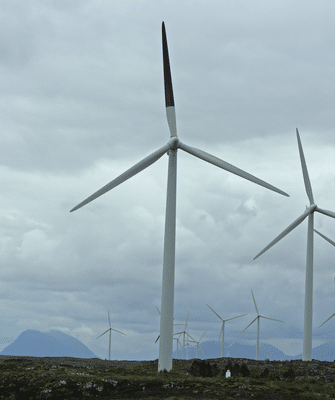
Realistic image
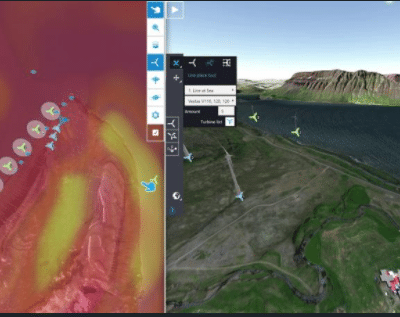
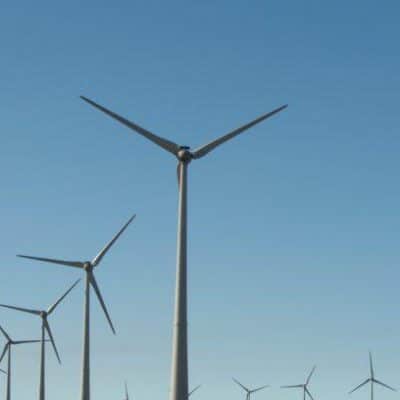
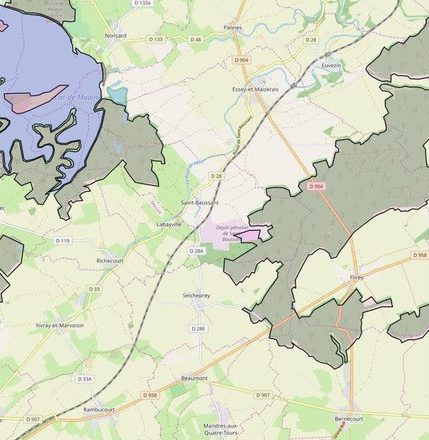
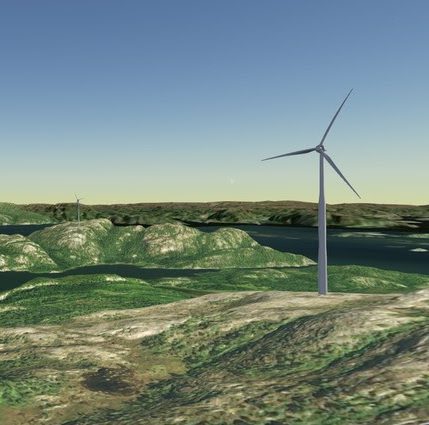
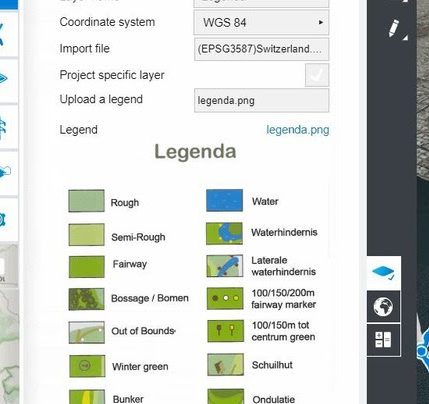
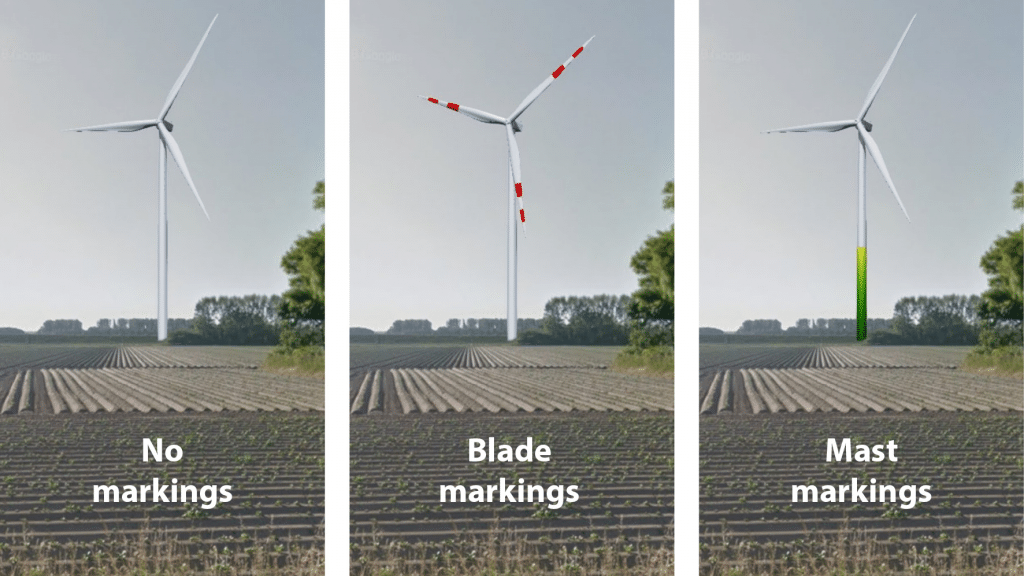
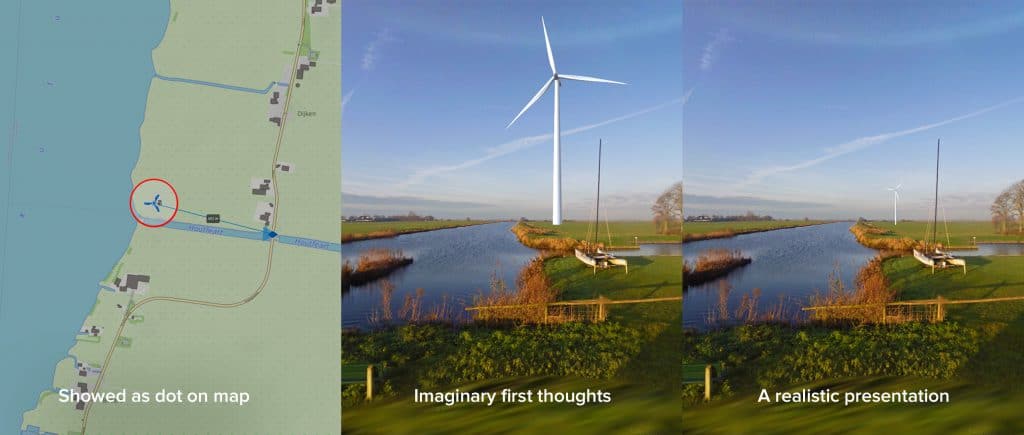
Windplanner is a web application that enables project developers to give those involved in a wind and solar project a realistic image. The tool is suitable for planning, simulation, visualization and as a communication tool. The tool converts a sometimes abstract project drawing into a 3D visualization. On images, for example from Google Streetview, you can draw windmills and adjust them in terms of size, number or type. The tool calculates the effects of wind direction, wind force and shadow on the mills and their environment. In addition to the photo visualizations, maps with geographic information can also be used in the application to optimally plan a project and to explain the plan to the environment.
Energy transition and strong partners
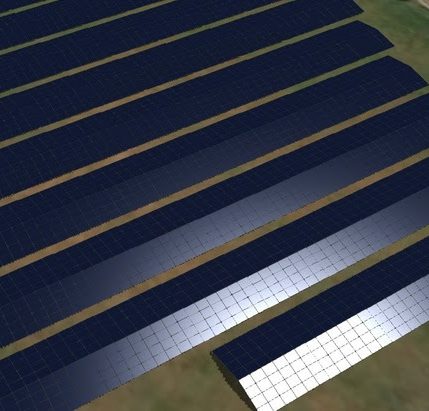
Windplanner has all common wind turbine models and solar panels in the software. The applicability is therefore large. Strong partners, such as two regional development companies, support this innovation. Windplanner now has a significant market share in the Netherlands and Windplanner is also gaining a foothold abroad with this “typically Dutch innovation”. With better visualization, plans for clean energy projects become more comprehensible, and this tool can contribute to the acceleration of the upcoming energy transition.